


help
486 Subscribers 

help > Graph-theory in conn
Showing 1-10 of 10 posts
Jul 9, 2012 05:07 PM | Igor M
Graph-theory in conn
Hello conn users,
I've never worked with conn before and now I am trying to use it for a graph-theory analysis of resting state data.
The software is a bit overwhelming and the PDF manual seems geared towards task-based data, so any help would be appreciated!
(This thread helped somewhat: http://www.nitrc.org/forum/message.php?msg_id=4678 )
The following input data is used:
(1) one participant's resting-state fMRI (128 time points, 2s TR) in MNI152 space (2mm)
(2) MNI152T1 as the structural image
(2) ROIs (GM, WM, CSF) obtained by segmenting the MNI152 T1
(3) BA ROIs that come with conn (these are intended to be used for computing graph-theory measures)
(4) condition: "rs", onset: 0, duration: 256
No covariates, 0.01-0.08 band pass filtered, WM and CSF masks used to define GLM confounds in "Preprocessing"
After all is said and done, the output doesn't look right:
Jul 9, 2012 10:07 PM | Igor M
RE: Graph-theory in conn
It looks like I solved the above problem by running an analysis
with 2 participants instead of just 1.
Results are now showing up in the "Network theory" window.
My question now is how to interpret these.
What are the "beta, T, p-unc, and p-FDR" values related to?
Are these based on the contrast that was set up in the "second-level Results" window?
What if I just want to look at the Global efficiency of a network based on all nodes and don't want a group contrast?
How do you display the actual parameters (i.e. actual "global efficiency")?
How do you display the correlation matrix between ROIs?
"Export data" creates one .csv file and a .dl file per subject, but these files are all empty for some reason.
Any help would be greatly appreciated.
Jul 10, 2012 08:07 AM | Alfonso Nieto-Castanon - Boston University
RE: Graph-theory in conn
Hi Igor,
You are right that the 'results' tab is for second-level analyses (to perform inferences about the population) so it requires multiple subjects. In any particular analysis, beta values represent effect sizes, T-values are the statistics, p-unc represent the false positive level of each individual test, and p-FDR represents the false discovery rate (a correction of the false positive level to account for multiple comparisons). All of these values depend on the actual contrasts that you choose for your second-level analyses. If you want to explore manually the graph-theory measures (e.g. global efficiency) for each subject 'export data' will create a .csv and a .network file with this information (the .network file can be loaded directly from matlab; the only reason I can think that would result in this files being 'empty' would be if you are using an overly conservative adjacency matrix threshold). If you want to explore the ROI-to-ROI connectivity matrix manually question 14 in the FAQ (http://www.alfnie.com/software/conn) should point you in the right direction.
Hope this helps
Alfonso
Originally posted by Igor M:
It looks like I solved the above problem by
running an analysis with 2 participants instead of just 1.
Results are now showing up in the "Network theory" window.
My question now is how to interpret these.
What are the "beta, T, p-unc, and p-FDR" values related to?
Are these based on the contrast that was set up in the "second-level Results" window?
What if I just want to look at the Global efficiency of a network based on all nodes and don't want a group contrast?
How do you display the actual parameters (i.e. actual "global efficiency")?
How do you display the correlation matrix between ROIs?
"Export data" creates one .csv file and a .dl file per subject, but these files are all empty for some reason.
Any help would be greatly appreciated.
Jul 10, 2012 05:07 PM | Igor M
RE: Graph-theory in conn
Thanks a lot, Alfonso!
I am not sure what I had the cost function set to last time, but I bumped it up to 0.4 and got a nice ".network" file with all the measures. Your help was very valuable.
One more question.
(1) If I do want to compare measures between groups, should I set the contrasts to the following:
Between-subjects: [1, -1]
Between-conditions: 1
Between-sources: 1
Additionally, I would also need second-level covariates called "Control" and "Patient" and these should be set to [1 1 0 0] and [0 0 1 1] for four participants who are [Control, Control, Patient, Patient].
Is this correct? I think it should be, but don't want to incorrectly assume anything.
- IM
EDIT:
One more question.
How can I use the AAL template provided here with conn? When using the "ROI_MNI_V4.nii" file there is an error message saying that "ROI_MNI_V4.txt" is not in the correct format.
How exactly should the label file be formatted?
I tried to figure out the correct formatting based on BA.txt but couldn't.
1 (L). Primary Somatosensory Cortex
1 (R). Primary Somatosensory Cortex
10 (L). Anterior Prefrontal Cortex
10 (R). Anterior Prefrontal Cortex
What do the numbers in the left column match up with? There are no voxels with those values in BA.img.
EDIT#2: I think I figured it out. Is the labeling based on line number within BA.txt (i.e. (L)Primary Somatosensory Cortex has a voxel intensity of 1, (R)Primary Somatosensory Cortex has a voxel intensity of 2, (L). Anterior Prefrontal Cortex is 3)?
Do you have a correctly labeled AAL template? It would save me a lot of time if I could avoid having to relabel all 90 regions.
Thanks!!
Originally posted by Alfonso Nieto-Castanon:
Hi Igor,
You are right that the 'results' tab is for second-level analyses (to perform inferences about the population) so it requires multiple subjects. In any particular analysis, beta values represent effect sizes, T-values are the statistics, p-unc represent the false positive level of each individual test, and p-FDR represents the false discovery rate (a correction of the false positive level to account for multiple comparisons). All of these values depend on the actual contrasts that you choose for your second-level analyses. If you want to explore manually the graph-theory measures (e.g. global efficiency) for each subject 'export data' will create a .csv and a .network file with this information (the .network file can be loaded directly from matlab; the only reason I can think that would result in this files being 'empty' would be if you are using an overly conservative adjacency matrix threshold). If you want to explore the ROI-to-ROI connectivity matrix manually question 14 in the FAQ (http://www.alfnie.com/software/conn) should point you in the right direction.
Hope this helps
Alfonso
Originally posted by Igor M:
You are right that the 'results' tab is for second-level analyses (to perform inferences about the population) so it requires multiple subjects. In any particular analysis, beta values represent effect sizes, T-values are the statistics, p-unc represent the false positive level of each individual test, and p-FDR represents the false discovery rate (a correction of the false positive level to account for multiple comparisons). All of these values depend on the actual contrasts that you choose for your second-level analyses. If you want to explore manually the graph-theory measures (e.g. global efficiency) for each subject 'export data' will create a .csv and a .network file with this information (the .network file can be loaded directly from matlab; the only reason I can think that would result in this files being 'empty' would be if you are using an overly conservative adjacency matrix threshold). If you want to explore the ROI-to-ROI connectivity matrix manually question 14 in the FAQ (http://www.alfnie.com/software/conn) should point you in the right direction.
Hope this helps
Alfonso
Originally posted by Igor M:
It looks like I solved the above problem by
running an analysis with 2 participants instead of just 1.
Results are now showing up in the "Network theory" window.
My question now is how to interpret these.
What are the "beta, T, p-unc, and p-FDR" values related to?
Are these based on the contrast that was set up in the "second-level Results" window?
What if I just want to look at the Global efficiency of a network based on all nodes and don't want a group contrast?
How do you display the actual parameters (i.e. actual "global efficiency")?
How do you display the correlation matrix between ROIs?
"Export data" creates one .csv file and a .dl file per subject, but these files are all empty for some reason.
Any help would be greatly appreciated.
Results are now showing up in the "Network theory" window.
My question now is how to interpret these.
What are the "beta, T, p-unc, and p-FDR" values related to?
Are these based on the contrast that was set up in the "second-level Results" window?
What if I just want to look at the Global efficiency of a network based on all nodes and don't want a group contrast?
How do you display the actual parameters (i.e. actual "global efficiency")?
How do you display the correlation matrix between ROIs?
"Export data" creates one .csv file and a .dl file per subject, but these files are all empty for some reason.
Any help would be greatly appreciated.
Jul 11, 2012 02:07 AM | Alfonso Nieto-Castanon - Boston University
RE: Graph-theory in conn
Hi Igor,
Regarding the question about second-level contrasts, you are exactly right, you would first create (in Setup->Covariates->Second-level) one 'Control' (set to [1 1 0 0]) and one 'Patient' (set to [0 0 1 1]) covariate. Then, when defining the contrasts of interest (in the Results tab) you would select both your 'Control' and 'Patient' effects in the 'Subject effects' list, and enter in 'between-subject contrast' [1,-1] (if you want to estimate the differences between control and patients). If you have a single condition (e.g. 'rest') you would simply select it from the 'conditions' list (and enter simply 1 in the 'between-conditions' contrast), and similarly if you have a single seed ROI (e.g. for seed-to-voxel analyses) you would select that and enter simply 1 in the corresponding contrast field.
Regarding the atlas files, there are two formats of the associated .txt files that can be entered to conn:
1) [ROI_label]: as you described, you simply enter in order all of the labels in the atlas (the one in the first row of the .txt file will correspond to the areas in the .nii file labeled as '1', the label in the second row will correspond to the areas labeled as '2', etc.)
2) [ROI_number ROI_label]: you can also enter pairs of numbers/labels (separated by a whitespace or a tab) and, for each pair, conn will associate the areas in the .nii file labeled as 'ROI_number' value with the associated 'ROI_label' string.
In addition you can also use (instead of a .txt file) a .csv file (comma-separated file) or .xls file (excel format) using the same convention as the case (2) above (two columns, the first with ROI numbers and the second with ROI labels).
In any way, if you are interested you can also find the AAL atlas (relabeled to this format) in the standard distribution of conn under the directory conn/utils/otherrois/ (the files named aal.nii and aal.txt)
Hope this helps
Alfonso
Originally posted by Igor M:
Thanks a lot, Alfonso!
I am not sure what I had the cost function set to last time, but I bumped it up to 0.4 and got a nice ".network" file with all the measures. Your help was very valuable.
One more question.
(1) If I do want to compare measures between groups, should I set the contrasts to the following:
Between-subjects: [1, -1]
Between-conditions: 1
Between-sources: 1
Additionally, I would also need second-level covariates called "Control" and "Patient" and these should be set to [1 1 0 0] and [0 0 1 1] for four participants who are [Control, Control, Patient, Patient].
Is this correct? I think it should be, but don't want to incorrectly assume anything.
- IM
EDIT:
One more question.
How can I use the AAL template provided here with conn? When using the "ROI_MNI_V4.nii" file there is an error message saying that "ROI_MNI_V4.txt" is not in the correct format.
How exactly should the label file be formatted?
I tried to figure out the correct formatting based on BA.txt but couldn't.
1 (L). Primary Somatosensory Cortex
1 (R). Primary Somatosensory Cortex
10 (L). Anterior Prefrontal Cortex
10 (R). Anterior Prefrontal Cortex
What do the numbers in the left column match up with? There are no voxels with those values in BA.img.
EDIT#2: I think I figured it out. Is the labeling based on line number within BA.txt (i.e. (L)Primary Somatosensory Cortex has a voxel intensity of 1, (R)Primary Somatosensory Cortex has a voxel intensity of 2, (L). Anterior Prefrontal Cortex is 3)?
Do you have a correctly labeled AAL template? It would save me a lot of time if I could avoid having to relabel all 90 regions.
Thanks!!
Originally posted by Alfonso Nieto-Castanon:
I am not sure what I had the cost function set to last time, but I bumped it up to 0.4 and got a nice ".network" file with all the measures. Your help was very valuable.
One more question.
(1) If I do want to compare measures between groups, should I set the contrasts to the following:
Between-subjects: [1, -1]
Between-conditions: 1
Between-sources: 1
Additionally, I would also need second-level covariates called "Control" and "Patient" and these should be set to [1 1 0 0] and [0 0 1 1] for four participants who are [Control, Control, Patient, Patient].
Is this correct? I think it should be, but don't want to incorrectly assume anything.
- IM
EDIT:
One more question.
How can I use the AAL template provided here with conn? When using the "ROI_MNI_V4.nii" file there is an error message saying that "ROI_MNI_V4.txt" is not in the correct format.
How exactly should the label file be formatted?
I tried to figure out the correct formatting based on BA.txt but couldn't.
1 (L). Primary Somatosensory Cortex
1 (R). Primary Somatosensory Cortex
10 (L). Anterior Prefrontal Cortex
10 (R). Anterior Prefrontal Cortex
What do the numbers in the left column match up with? There are no voxels with those values in BA.img.
EDIT#2: I think I figured it out. Is the labeling based on line number within BA.txt (i.e. (L)Primary Somatosensory Cortex has a voxel intensity of 1, (R)Primary Somatosensory Cortex has a voxel intensity of 2, (L). Anterior Prefrontal Cortex is 3)?
Do you have a correctly labeled AAL template? It would save me a lot of time if I could avoid having to relabel all 90 regions.
Thanks!!
Originally posted by Alfonso Nieto-Castanon:
Hi Igor,
You are right that the 'results' tab is for second-level analyses (to perform inferences about the population) so it requires multiple subjects. In any particular analysis, beta values represent effect sizes, T-values are the statistics, p-unc represent the false positive level of each individual test, and p-FDR represents the false discovery rate (a correction of the false positive level to account for multiple comparisons). All of these values depend on the actual contrasts that you choose for your second-level analyses. If you want to explore manually the graph-theory measures (e.g. global efficiency) for each subject 'export data' will create a .csv and a .network file with this information (the .network file can be loaded directly from matlab; the only reason I can think that would result in this files being 'empty' would be if you are using an overly conservative adjacency matrix threshold). If you want to explore the ROI-to-ROI connectivity matrix manually question 14 in the FAQ (http://www.alfnie.com/software/conn) should point you in the right direction.
Hope this helps
Alfonso
Originally posted by Igor M:
You are right that the 'results' tab is for second-level analyses (to perform inferences about the population) so it requires multiple subjects. In any particular analysis, beta values represent effect sizes, T-values are the statistics, p-unc represent the false positive level of each individual test, and p-FDR represents the false discovery rate (a correction of the false positive level to account for multiple comparisons). All of these values depend on the actual contrasts that you choose for your second-level analyses. If you want to explore manually the graph-theory measures (e.g. global efficiency) for each subject 'export data' will create a .csv and a .network file with this information (the .network file can be loaded directly from matlab; the only reason I can think that would result in this files being 'empty' would be if you are using an overly conservative adjacency matrix threshold). If you want to explore the ROI-to-ROI connectivity matrix manually question 14 in the FAQ (http://www.alfnie.com/software/conn) should point you in the right direction.
Hope this helps
Alfonso
Originally posted by Igor M:
It looks like I solved the above problem by
running an analysis with 2 participants instead of just 1.
Results are now showing up in the "Network theory" window.
My question now is how to interpret these.
What are the "beta, T, p-unc, and p-FDR" values related to?
Are these based on the contrast that was set up in the "second-level Results" window?
What if I just want to look at the Global efficiency of a network based on all nodes and don't want a group contrast?
How do you display the actual parameters (i.e. actual "global efficiency")?
How do you display the correlation matrix between ROIs?
"Export data" creates one .csv file and a .dl file per subject, but these files are all empty for some reason.
Any help would be greatly appreciated.
Results are now showing up in the "Network theory" window.
My question now is how to interpret these.
What are the "beta, T, p-unc, and p-FDR" values related to?
Are these based on the contrast that was set up in the "second-level Results" window?
What if I just want to look at the Global efficiency of a network based on all nodes and don't want a group contrast?
How do you display the actual parameters (i.e. actual "global efficiency")?
How do you display the correlation matrix between ROIs?
"Export data" creates one .csv file and a .dl file per subject, but these files are all empty for some reason.
Any help would be greatly appreciated.
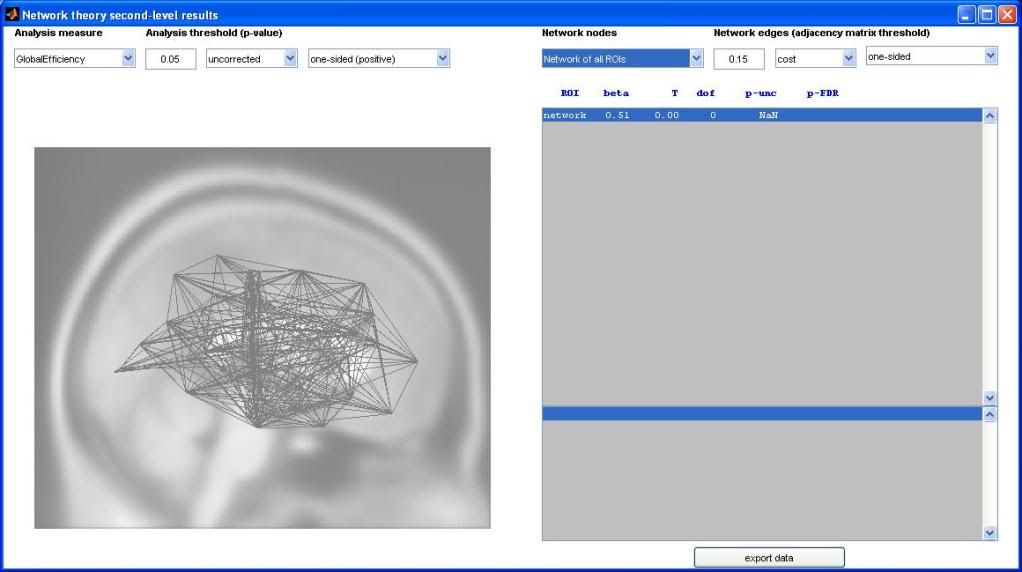
Jul 12, 2012 11:07 PM | Igor M
RE: Graph-theory in conn
Thanks, Alfonso!
Using pre-formatted AAL ROI files has been a real time saver.
The analysis seems to work fine and I can retrieve all measures (local efficiency, global efficiency, betweenness, so on) from the *.network file.
My question now is about interpreting the group contrast ( [1 -1] ) results.
In other programs (e.g. FSL) this contrast would highlight areas of the cortex where a measure is greater in "group A" than in "group B".
I ran this contrast and several nodes became highlighted in the graph-theory window. My question is this: what metric is being compared at those nodes? "GlobalEfficiency" is selected as the "Analysis measure" on the left side of the window, but GlobalEfficiency pertains to an entire network, not a single node. In other words, I didn't think that it could be compared between groups at single nodes.
In the "network nodes" tab "network of all ROIs" is selected. A screenshot is attached to this post.
IM
Jul 13, 2012 08:07 AM | Alfonso Nieto-Castanon - Boston University
RE: Graph-theory in conn
Hi Igor
The statistical test comparing the global efficiency of the entire network across your two subject groups is reported in the top-right list (in the row labeled as 'network'); in addition, the global efficiency of the entire network can be represented as the average of the global efficiency of each node of the network (global efficiency of a node in a graph is defined as the average inverse shortest-path distance from this node to all other nodes in the graph). So yes, in addition to comparing between groups the global efficiency of the 'whole-brain' network, you can also compare between groups the global efficiency of individual nodes (ROIs) within this network (this is sometimes thought of as a measure of centrality or relative importance of a given node within a graph); the rest of the result rows shown in the top-right list correspond to the statistical test on the global efficiency measure for each of the nodes/ROIs (only shown those nodes that survive the chosen false positive threshold; the labels of these nodes are displayed in the bottom-right list). In your example attached it would seem that the increased global efficiency (of the entire brain network) in groupA (from the positive beta value and significant p-value in the 'network' row) could be perhaps attributed to an increased efficiency/centrality within the network of the particular ROIs shown in the results display (from their positive beta values and significant FDR-corrected p-values in the corresponding rows for each ROI). Let me know if this clarifies
Best
Alfonso
Originally posted by Igor M:
Thanks, Alfonso!
Using pre-formatted AAL ROI files has been a real time saver.
The analysis seems to work fine and I can retrieve all measures (local efficiency, global efficiency, betweenness, so on) from the *.network file.
My question now is about interpreting the group contrast ( [1 -1] ) results.
In other programs (e.g. FSL) this contrast would highlight areas of the cortex where a measure is greater in "group A" than in "group B".
I ran this contrast and several nodes became highlighted in the graph-theory window. My question is this: what metric is being compared at those nodes? "GlobalEfficiency" is selected as the "Analysis measure" on the left side of the window, but GlobalEfficiency pertains to an entire network, not a single node. In other words, I didn't think that it could be compared between groups at single nodes.
In the "network nodes" tab "network of all ROIs" is selected. A screenshot is attached to this post.
IM
Using pre-formatted AAL ROI files has been a real time saver.
The analysis seems to work fine and I can retrieve all measures (local efficiency, global efficiency, betweenness, so on) from the *.network file.
My question now is about interpreting the group contrast ( [1 -1] ) results.
In other programs (e.g. FSL) this contrast would highlight areas of the cortex where a measure is greater in "group A" than in "group B".
I ran this contrast and several nodes became highlighted in the graph-theory window. My question is this: what metric is being compared at those nodes? "GlobalEfficiency" is selected as the "Analysis measure" on the left side of the window, but GlobalEfficiency pertains to an entire network, not a single node. In other words, I didn't think that it could be compared between groups at single nodes.
In the "network nodes" tab "network of all ROIs" is selected. A screenshot is attached to this post.
IM
Jul 21, 2012 01:07 AM | Igor M
RE: Graph-theory in conn
Hello again,
Thanks for your quick replies. One more question.
The aal template provided by conn (conn\utils\otherrois\aal.nii) has 181x217x181 voxels and a 1x1x1mm spatial resolution.
Conn does not generate any error messages when this ROI template is used with the MNI152 structural image (91x109x91 voxels, 2x2x2mm). Does this mean that conn is registering one image to the other in the background?
Or should I register the aal template to MNI space myself and then just use the coregistered aal template for analysis?
I've run several analyses without realizing that this was happening and now I'm not sure if the results are legitimate.
Thanks!
Jul 21, 2012 07:07 PM | Alfonso Nieto-Castanon - Boston University
RE: Graph-theory in conn
Hi Igor,
The AAL atlas is already normalized/coregistered to MNI space (and the toolbox does not have any problem when specifying ROIs using volumes that have different voxel sizes and/or bounding box definitions from the MNI template, as long as these volumes are correctly normalized/coregistered), so you should be able to use this atlas without any modifications.
Best
Alfonso
Originally posted by Igor M:
Hello again,
Thanks for your quick replies. One more question.
The aal template provided by conn (conn\utils\otherrois\aal.nii) has 181x217x181 voxels and a 1x1x1mm spatial resolution.
Conn does not generate any error messages when this ROI template is used with the MNI152 structural image (91x109x91 voxels, 2x2x2mm). Does this mean that conn is registering one image to the other in the background?
Or should I register the aal template to MNI space myself and then just use the coregistered aal template for analysis?
I've run several analyses without realizing that this was happening and now I'm not sure if the results are legitimate.
Thanks!
Thanks for your quick replies. One more question.
The aal template provided by conn (conn\utils\otherrois\aal.nii) has 181x217x181 voxels and a 1x1x1mm spatial resolution.
Conn does not generate any error messages when this ROI template is used with the MNI152 structural image (91x109x91 voxels, 2x2x2mm). Does this mean that conn is registering one image to the other in the background?
Or should I register the aal template to MNI space myself and then just use the coregistered aal template for analysis?
I've run several analyses without realizing that this was happening and now I'm not sure if the results are legitimate.
Thanks!
Jan 21, 2014 10:01 PM | Saman Sarraf
RE: Graph-theory in conn
Hi all,
I have created a nii file including my favorite ROIs and a text file inclduing the name of the ROIS based on the instruction below.
I was wondering in which directory/folder I would need to put this text file?
I put both of them in the same folder with similar name (A.nii and A.txt) but the labels didn't come true.
Thanks in advance,
Saman