Date: 2016-04-26 16:37
Sender: Chris Rorden
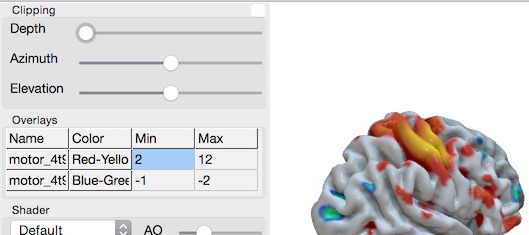
Yes, with Mango a parametric overlay is one which shows both
positive and negative peaks:
http://ric.uthscsa.edu/mango/usingmango_add.html
With both Surf Ice and MRIcroGL you do this by chooising the
Overlays/Add function twice, and selecting the same file each time.
You will now have two Entries n your Overlays panel (as shown in
the screenshot below). Set one of these to have negative min..max
range values and the other to have postive ones. You can set your
colors as you wish by using the Color pulldown menus, but it is
popular to use the Red-Yellow for positive and the Blue-Green
gradient for negative values (as shown in the screenshot). One way
to try this out is to run the "fmri_painted_surface" script (choose
Advanced/Scripting and then choose File/fmri_paint_surface from the
Script forms menu):
https://www.nitrc.org/plugins/mwiki/index.php/surfice:MainPage#Scripting_a_painted_overlay
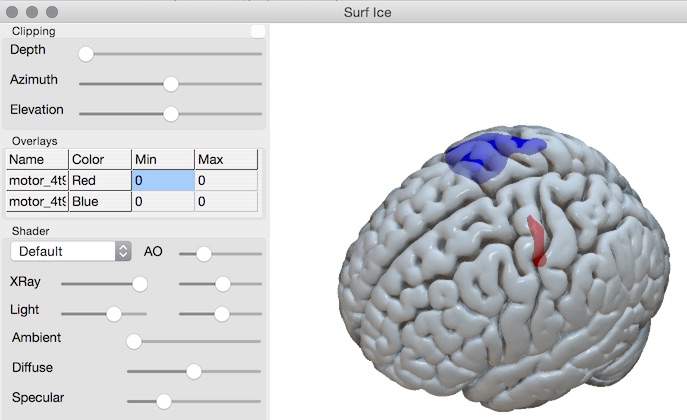
If you want to view your surface as a mesh (rather than a painted
surface), you can use the Advanced/ConvertVoxelwiseDataToMesh
command to convert your images. Again, you will do this twice: once
with a negative threshold and once with a positive threshold. You
can load the two resulting meshes with two calls to the Overlay/Add
command. This is shown in the second screenshot below. Again, you
can choose the color (here Red and Blue) but note that when you
load a mesh you can not set the minimum and maximum range (it is an
isosurface, your threshold was applied when you converted the image
to a mesh).
|


